


")


")


How to Add a WordPress Query Monitor On Your Website
Are you WordPress developer? Do you develop Themes and plugins? then you apparently arise with the problem of how to check the site performance. In this article we will help you to use the WordPress Query Monitor on your Website.
In Some case, it happens when You’re working on a WordPress site having a dozen of plugins installed. However, your site isn’t buzzing along quite the way you’d like it to.
You’ve eliminated all of the usual suspects, You set up the hosting in an adequate way, JavaScript or PHP errors, and there is nothing erring. Same time you assume that may be one of the installed plugin generating an error, You can’t figure out which plugin is causing the problem?
Query Monitor is the high-grade option to check your WordPress performance.
Let’s go with this Article to learn How to Debug WordPress performance issues like a pro:
What is WordPress Query Monitor?

So, If you want to check the performance of your WordPress, it’s a good way to go through Query Monitor. Owning the right tools can make your job easier.
Also, Query Monitor is a free tool which saves your money as well as a lot of time. You can use it to:
Query Monitor is a tool (Plugin) that provides loads of details about how your WordPress queries and plugins are performing. This will help you out in investigating issues with the code running on your site.
If you are thinking about the Google ranks according to the performance of your site, This isn’t going to tell you how Google ranks your site’s performance.
When you get those details of your WordPress site you can now, troubleshoot WordPress issues and heat the errors.
Some of the things you can look up are:
DATABASE QUERIES
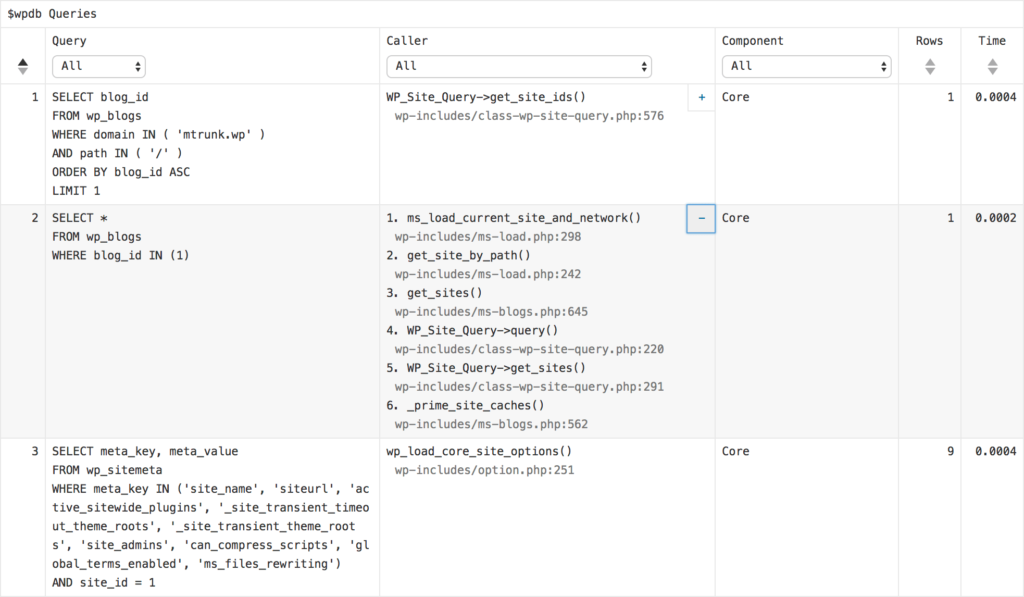 Shows all database Database queries triggered by a page in WordPress.
PHP ERRORS
PHP errors (warnings, notices and deprecated) are presented nicely along with their component and call stack.
REWRITE RULES
Shows all matching rewrite rules for the current request.
HTTP REQUEST
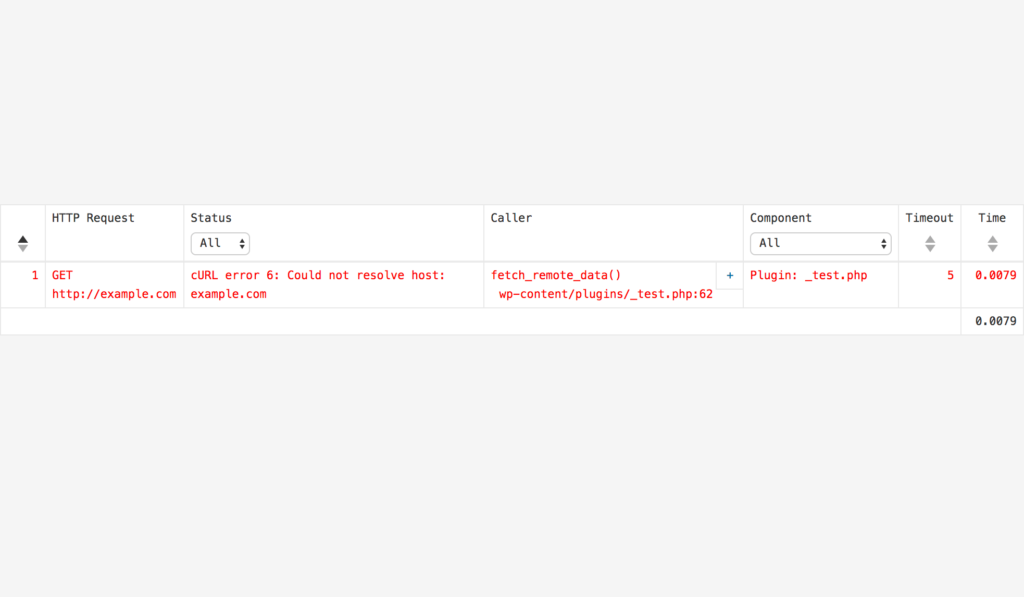
HTTP requests made by scripts in your themes or plugins
SCRIPTS & STYLES
Shows all enqueued scripts and styles on the current request, along with their URL and version
HOOKS
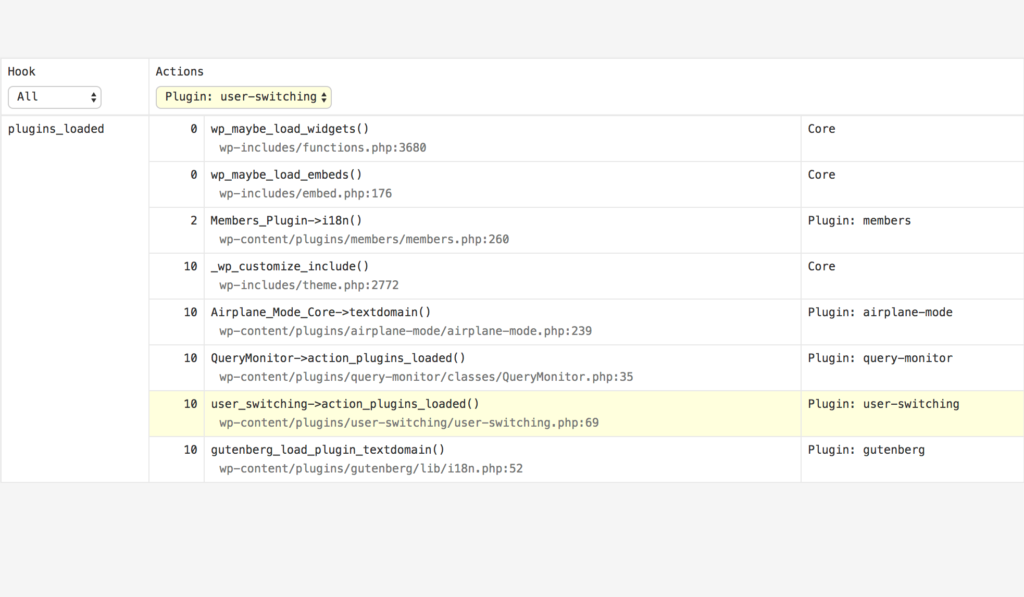
- Shows all hooks fired on the current request, along with hooked actions, their priorities, and their components
- Filter hooks by part of their name
LANGUAGES
Shows language settings and text domains
Now, let’s have an eye how to add a query monitor on your WordPress site.
Adding Query Monitory in WordPress:
First thing is to install and activate the Query Monitor plugin. Either, you can have it from GitHub or from the WordPress plugin directory.
Once you install the plugin, you’ll notice is that a new menu item (Query Monitor) has been added to the WordPress admin bar:
The label on the new item displays a menu few metrics:
- Page generation time,
- Peak PHP memory usage,
- Database query time, and
- The total number of database queries made.
You can see all of the data generated by Query Monitor is contained in a single report added to the foot of the page and broken into multiple sections.
How to View WordPress Query Monitor Data
The site contains an admin bar so, when you are viewing your website, you Simply go to Users » Your Profile page and check the box next to ‘Show Toolbar when viewing site’ option.
Let’s go, Don’t be jam by the performance of your WordPress site and Dig into WordPress performance issues with Query Monitor.


")


